Dashboards
A dashboard is a page of charts you arrange yourself, so the numbers you check every week are in one place. The Dashboards tab lists your dashboards alongside the built-in analytics.
Tiles that show cost need access to cost figures — ask your Flowstate admin.
Find a dashboard
Go to Insights → Analytics & reporting → Dashboards.
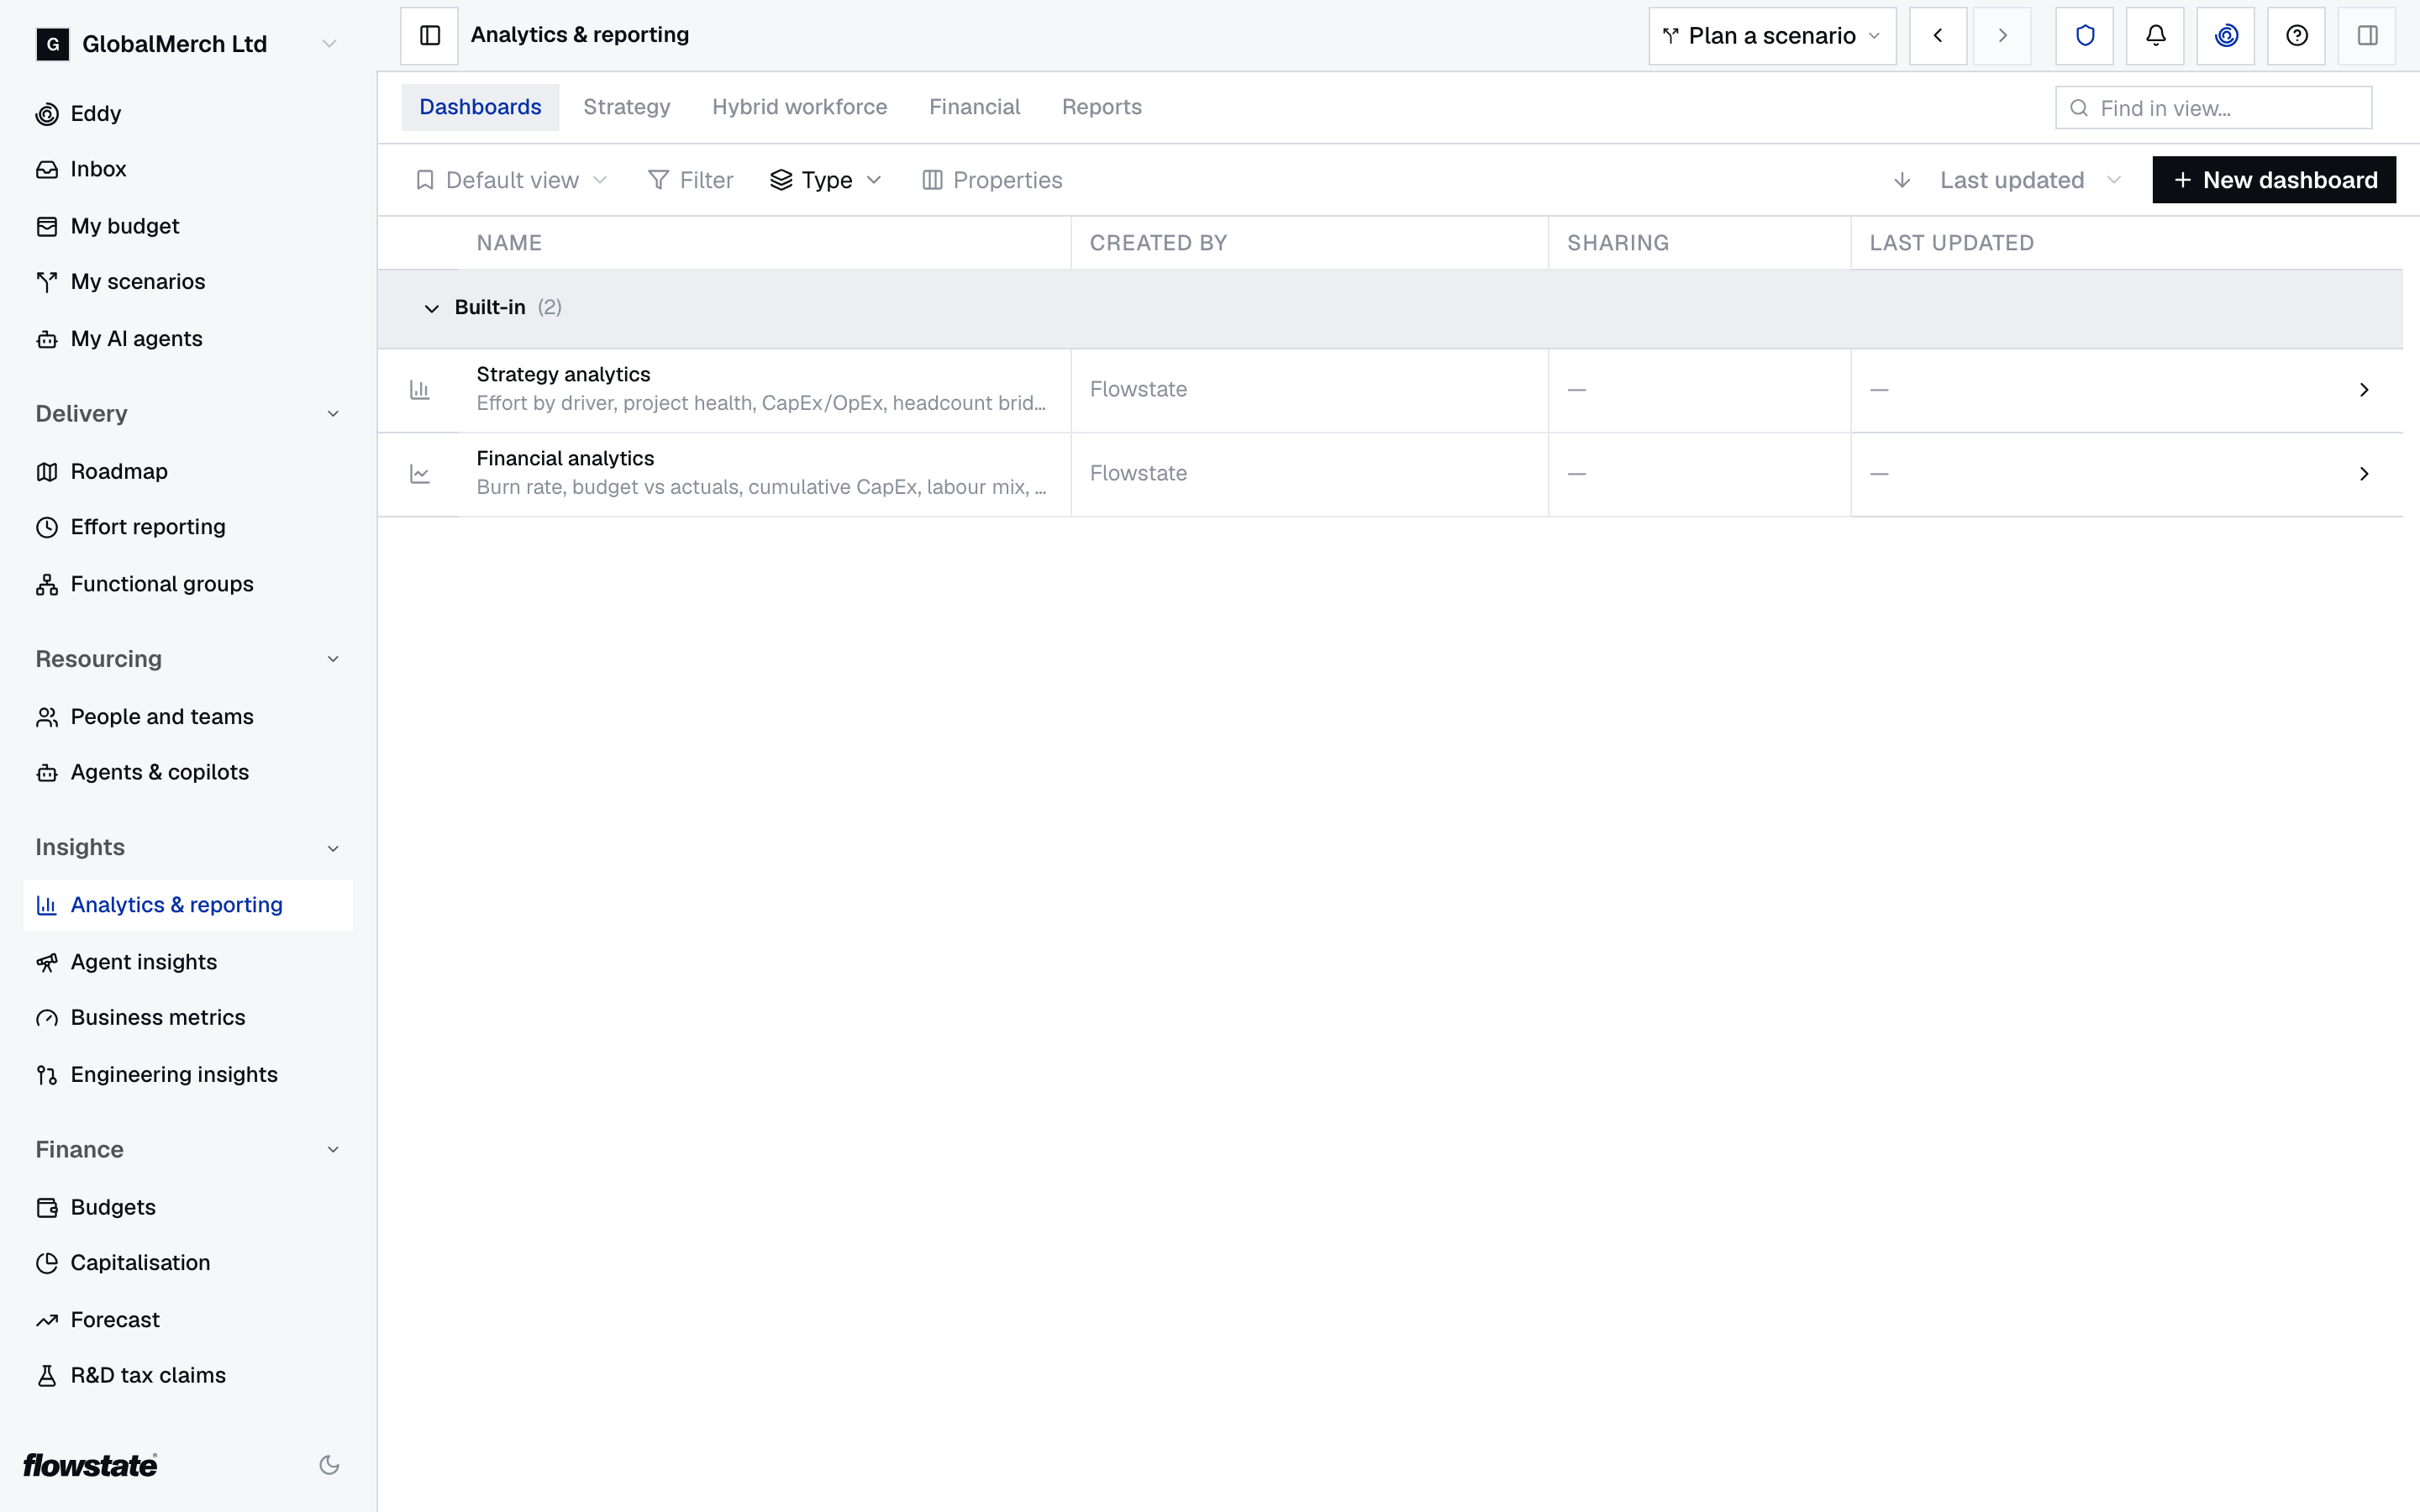
- Built-in holds Strategy analytics and Financial analytics, made by Flowstate.
- User-owned holds dashboards people in your organisation have made.
- Filter by Visibility (Private or Shared) or Owner (My dashboards or Shared with me), and sort by Last updated or Title.
Create a dashboard
- On the Dashboards tab, select New dashboard.
- In Create dashboard, enter a Title.
- Optionally add a Description.
- Select Create.
The new dashboard opens. It’s private until you share it.
Add reports to a dashboard
- Open the dashboard.
- Open the gear menu (Actions) and select Edit Layout.
- Select Add Report.
- In Add to dashboard, choose Templates or My reports.
- Drag a report onto the dashboard.
- Drag tiles by their grip to reorder them, and drag their edges to resize them.
- Select Stop Editing.
The layout saves as you go. While editing, select a tile’s title to rename its report, the pencil to edit the report, or the X to take it off the dashboard. Taking a tile off doesn’t delete the report.
My reports lists the reports you’ve made. A report sits on one dashboard at a time, so dragging in a report that’s on another dashboard moves it here. See Put a report on a dashboard.
Start from a template
Templates are ready-made reports. Adding one to a dashboard creates a report of your own, which you can then change.
- Open a dashboard you made.
- Open the gear menu (Actions) and select Edit Layout.
- Select Add Report. Templates opens first.
- Select Preview on a template to see it, then Add to Dashboard. Or drag the template onto the dashboard.
- Select Stop Editing.
These templates help you read what delivery and AI return:
| Template | What it shows |
|---|---|
| AI Delivery — Cost vs Human Baseline | A table by team of Merged PRs, Cost per PR and AI Cost, split into agent, AI-assisted and human pull requests. See Compare delivery with and without AI |
| AI Adoption by Team | AI sessions and AI cost by team and AI provider. It counts use, not how many licensed seats are in use |
| Capitalisation Coverage by Project | Merged pull requests for each project, split by CapEx, OpEx and pull requests with no project |
| Strategic Effort Distribution | Planned FTE across your strategic drivers |
| Project Health Matrix | Each project’s spend against its timeline |
| Zombie Project Costs | Cost still going to projects that are paused or finished |
| CapEx/OpEx Monthly Trend | Cost each month by CapEx and OpEx |
Other templates cover hiring, headcount, team size, location, role cost and labour mix.
A template reads the dates you choose on the dashboard. Templates that show cost need access to cost figures.
Filter a dashboard and choose dates
At the top of a dashboard:
- Filter by Team, Location, Role or Resource Type (Employee, Contractor or Vacancy). Filters reset when you leave the dashboard.
- Choose the dates with the period control. The dashboard remembers them in this browser.
Make a dashboard your default
- On the Dashboards tab, open the row menu of a dashboard you made.
- Select Set as default.
Opening Analytics & reporting now takes you straight to it. Your default only affects you.
Share a dashboard
You can share dashboards you’ve made.
- Open the dashboard and select Share.
- Under Add people, search by name or email, then select Add as viewer for each person.
- To let everyone in your organisation view it, turn on Anyone in your organisation.
- Select Done.
People you add can view the dashboard and every report on it. They find it under Shared with me. To stop sharing with someone, find them under People with access and select the X (Remove access).
Delete a dashboard
- On the Dashboards tab, open the dashboard’s row menu and select Delete. Or open the dashboard, open the gear menu (Actions) and select Delete Dashboard.
- Confirm.
Deleting a dashboard doesn’t delete its reports. In the row menu, Edit opens the dashboard.
If something’s not right
A tile says “Financial data restricted”. It shows cost, and you don’t have access to cost figures.
There’s no Share button or gear menu. Someone else made the dashboard. Only the person who made a dashboard can share it or change it.
Your filters have reset. Dashboard filters aren’t saved. Set them again when you open the dashboard.
The dates are different on another computer. Dates are remembered in each browser separately.
You want the numbers in a spreadsheet. Dashboards can’t be exported. Use the forecast export on Forecast.