Read and export the forecast
The forecast shows what your workforce is planned to cost, month by month — every employee, contractor, vacancy and AI agent, across the teams and projects they’re allocated to. Use it for month-end, a board pack, or to check what a plan will cost before you commit to it.
It’s worked out from your live records, so it changes as soon as a salary, allocation or start date changes. How each figure is calculated is on How costs are calculated.
Where: Finance → Forecast
Everyone sees FTE for the teams they can see. To see cost as well, you need access to financial figures — ask your Flowstate admin.
Read the forecast
- Choose Group by: Projects (the default), Initiatives, Teams or Cost Centres.
- Choose Monthly, Quarterly or Yearly, and set the dates. The forecast opens on your current fiscal year.
- To look at one team, select All teams and pick the team. Its sub-teams are included.
- Expand a row to see who’s in it. Select a person, team or project name to open its side panel.
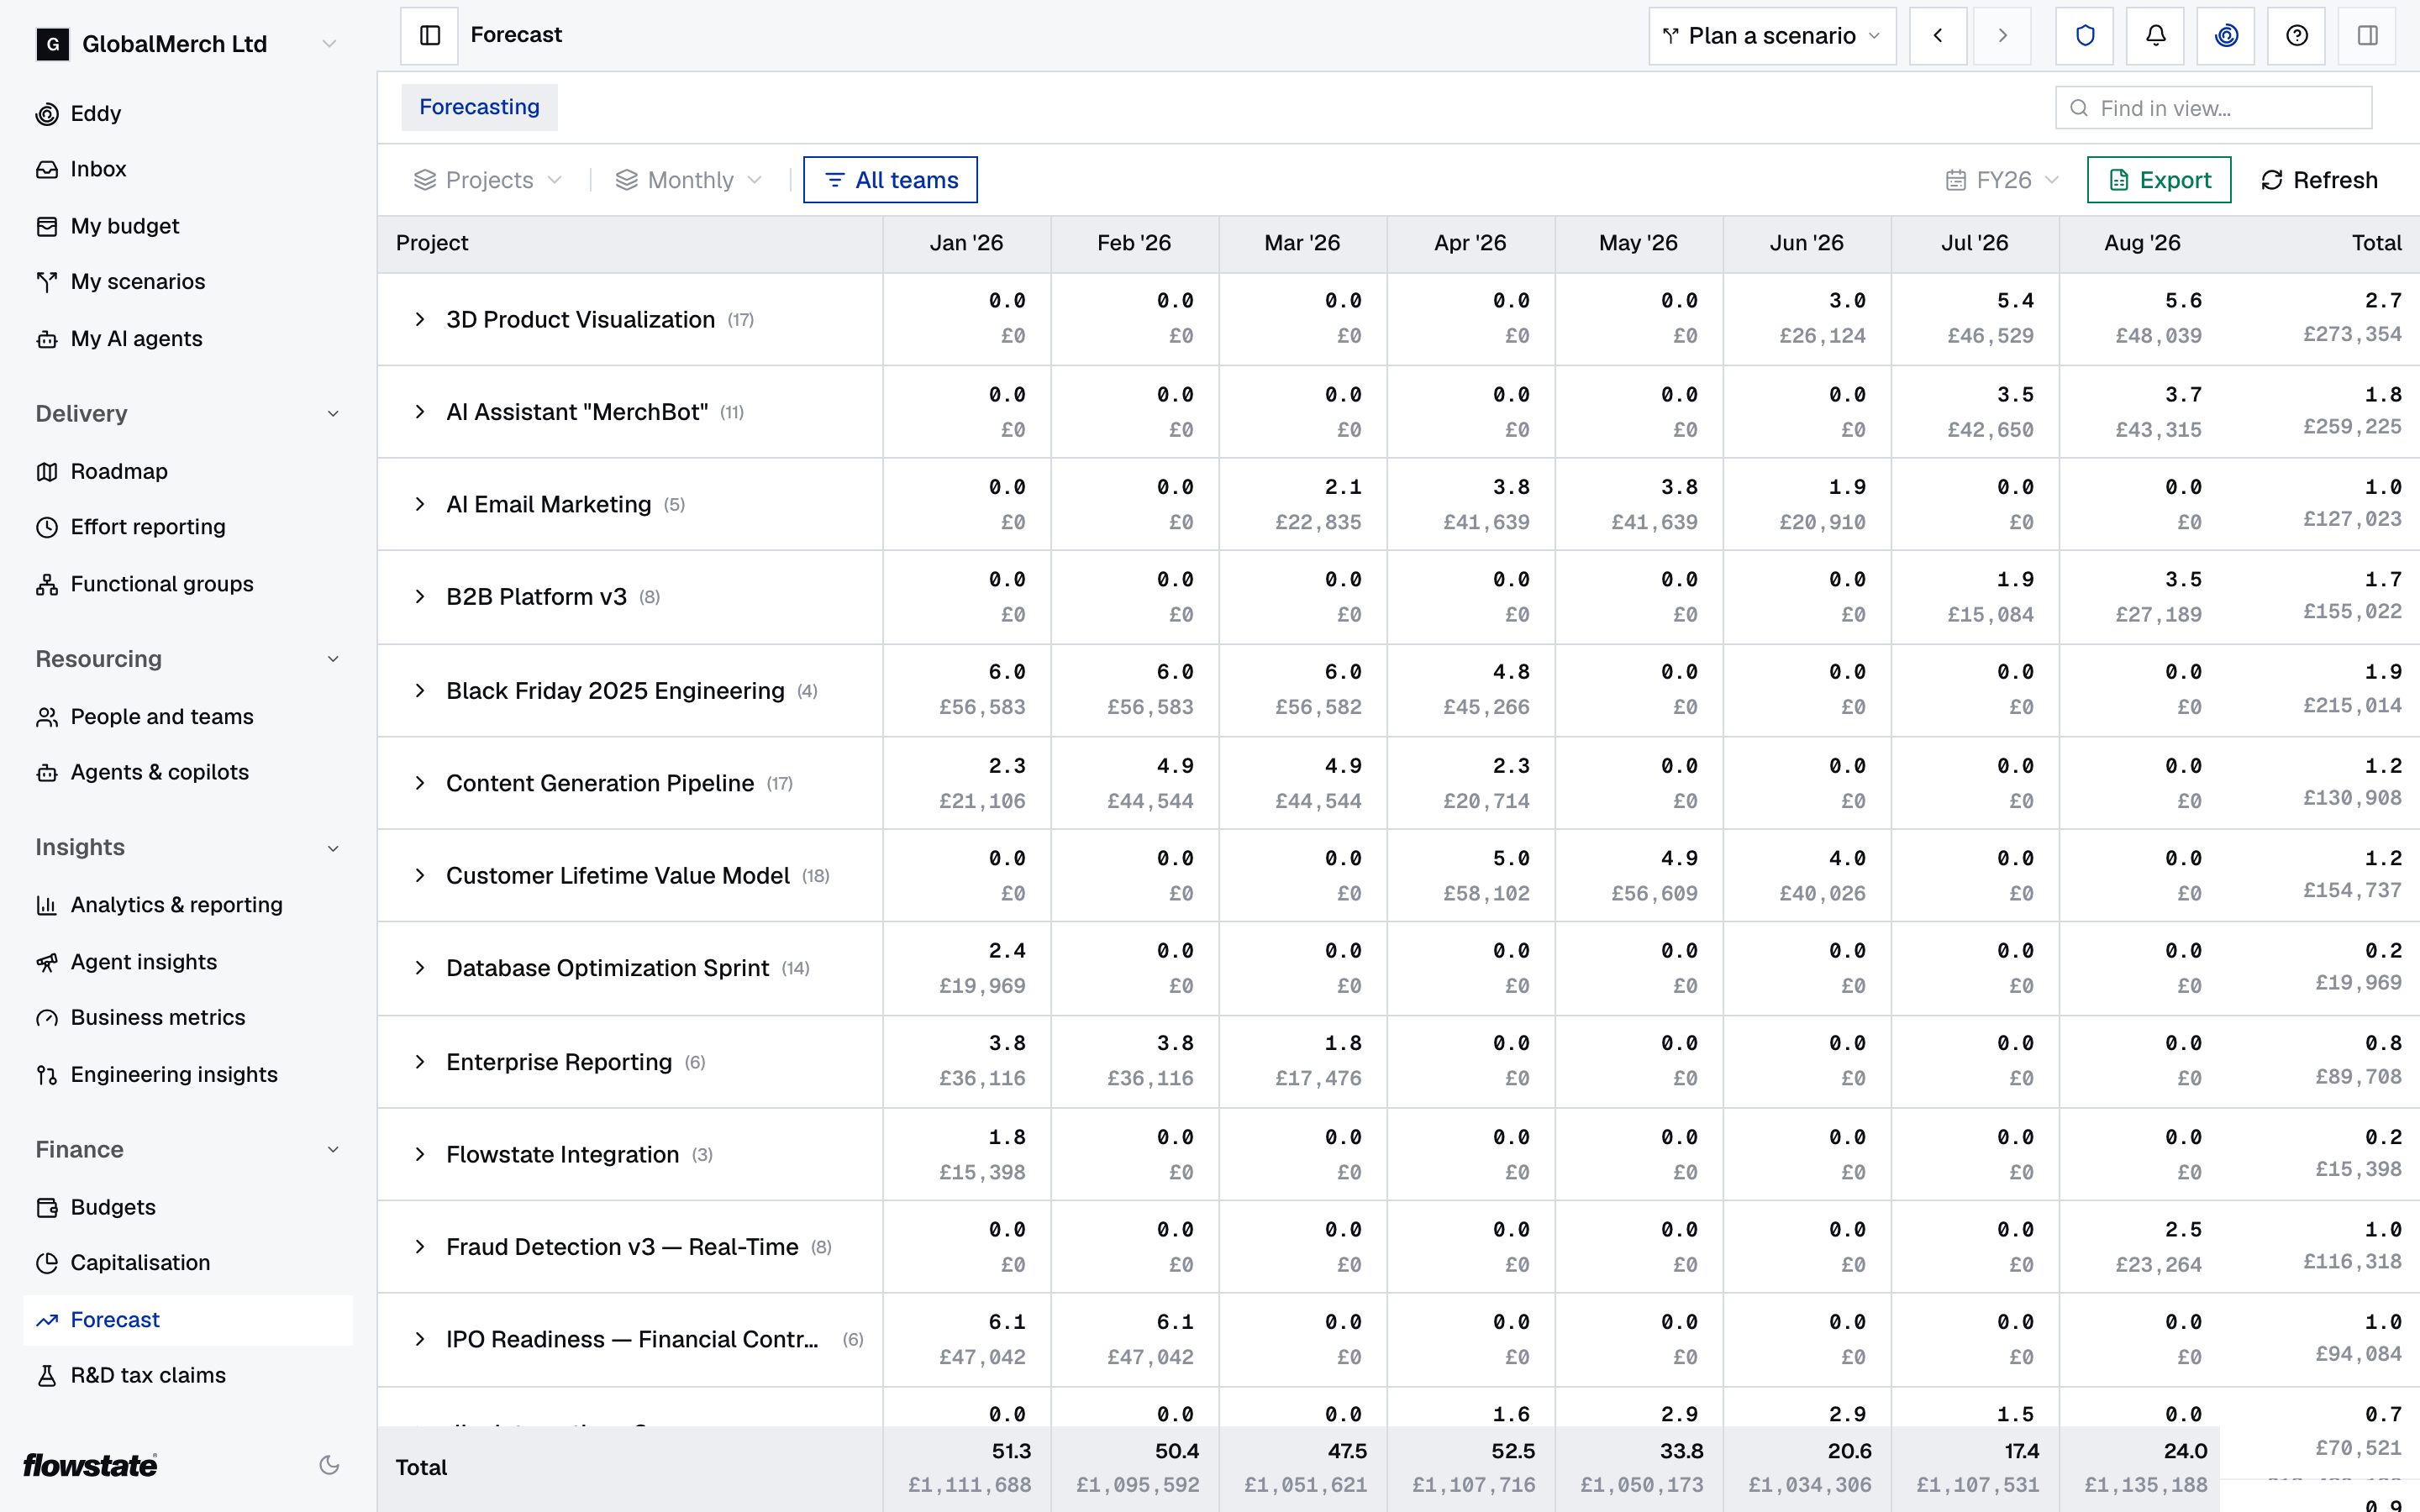
Each cell shows FTE, with the cost underneath if you can see cost.
- The number in brackets after a name is how many people are allocated to it, including sub-teams.
- Cost that doesn’t belong to a row collects in No Team, No Project, No Cost Center or No initiative.
- A bonus is added in full to the month it’s paid, so a month can spike. See Bonuses.
- AI usage (forecast) rows are an estimate for information. They aren’t added to the total.
- After a bulk change, such as an import or new exchange rates, select Refresh beside Forecast as of.
Compare with a budget
The forecast keeps following your live records after a budget is accepted, so the two drift apart over the year. To see by how much, and why:
- open the budget version on Finance → Budgets → Budgets and select the Drift tab for every change since the budget was set;
- check the Budget column on Resourcing → People and teams → Teams to see which teams are over or under.
See Track the forecast against your budget.
See what a scenario changes
Open the forecast while you’re in a scenario, and the figures include the scenario’s changes.
- Select Highlight.
- Choose FTE Impact or Financial Impact.
With Financial Impact, red rows cost more and green rows cost less. With FTE Impact, green rows gain FTE and red rows lose it.
Change an allocation from the forecast
- Expand a team or project and select the FTE figure on a person’s row.
- Under Direct Allocations, change the FTE and select Save. On a project, you can also use Add Direct Allocation to add someone.
Time that reaches a project through a team is shown under Via Team and is changed on the team. When grouped by Teams, select a team’s FTE figure to change that team’s allocation.
The change saves straight away — to your live records, or only to the scenario if you’re in one. See Allocations.
Export the forecast
- Set the grouping, team and dates you want. The export uses the same team and dates.
- Select Export.
- In Forecast Export, check the Mode — Live Data or Scenario — and choose the Granularity.
- Under Standard fields and Custom attributes, tick any extra columns you want, such as Role or Line manager.
- Select Export.
You get an Excel workbook built with live formulas, so anyone checking it can follow how each figure is made. It has a summary, your employees, contractors and vacancies with their pay, the exchange rates and overheads used, and the forecast by team and by project.
If something’s not right
You see FTE but no cost, or the export’s costs are all zero. You don’t have access to financial figures. Ask your Flowstate admin.
A team is missing. You see the teams you manage and those beneath them, unless your role lets you see every team.
The forecast doesn’t match Capitalisation. They measure different things: the forecast is planned cost from allocations, and Capitalisation is actual cost from effort. See Why the forecast and actuals can differ.