Capitalisation
Capitalisation shows how much of what your engineering work actually cost can be capitalised, where the rest went, and whether every capitalised project has an approved justification. Use it to close a month, quarter or year.
The figures come from effort — what people worked on, week by week — costed at each person’s day rate and sorted by each project’s cost centre. See How capitalisation works.
Where: Finance → Capitalisation. Ask your Flowstate contact to switch it on. If you don’t have access to financial figures, you see days of effort instead of money.
Close a period
- Go to Finance → Capitalisation and choose the period.
- Under Reporting source, choose Effort submissions, so only weeks team leads have submitted are counted.
- On Overview, work through Needs your attention.
- On Projects, if there’s an Unattributed effort row, clear it.
- On Rationales, check every CapEx project has an approved justification.
- Export your capitalisation figures.
The tabs
| Tab | Use it to |
|---|---|
| Overview | See what share of the period’s cost is capitalised, where the rest went, and what needs fixing |
| Targets | Track each team against its CapEx target. See Set CapEx targets |
| Teams | See CapEx, OpEx and CapEx % by team, and open a team |
| Initiatives | See the same by initiative, and capitalise a whole initiative |
| Projects | See cost by project, set each project’s cost centres, and follow each justification |
| Rationales | See where each CapEx project’s justification is up to. See The Rationales tab |
| Unclaimed | Find people with effort who aren’t in any team, and put them on one |
The period and Reporting source you choose stay the same as you move between tabs. Most tabs also let you filter by Resource type: Employees, Contractors or AI agents. Overview, Teams and Projects have Export if you can see detailed financial figures.
Read the Overview
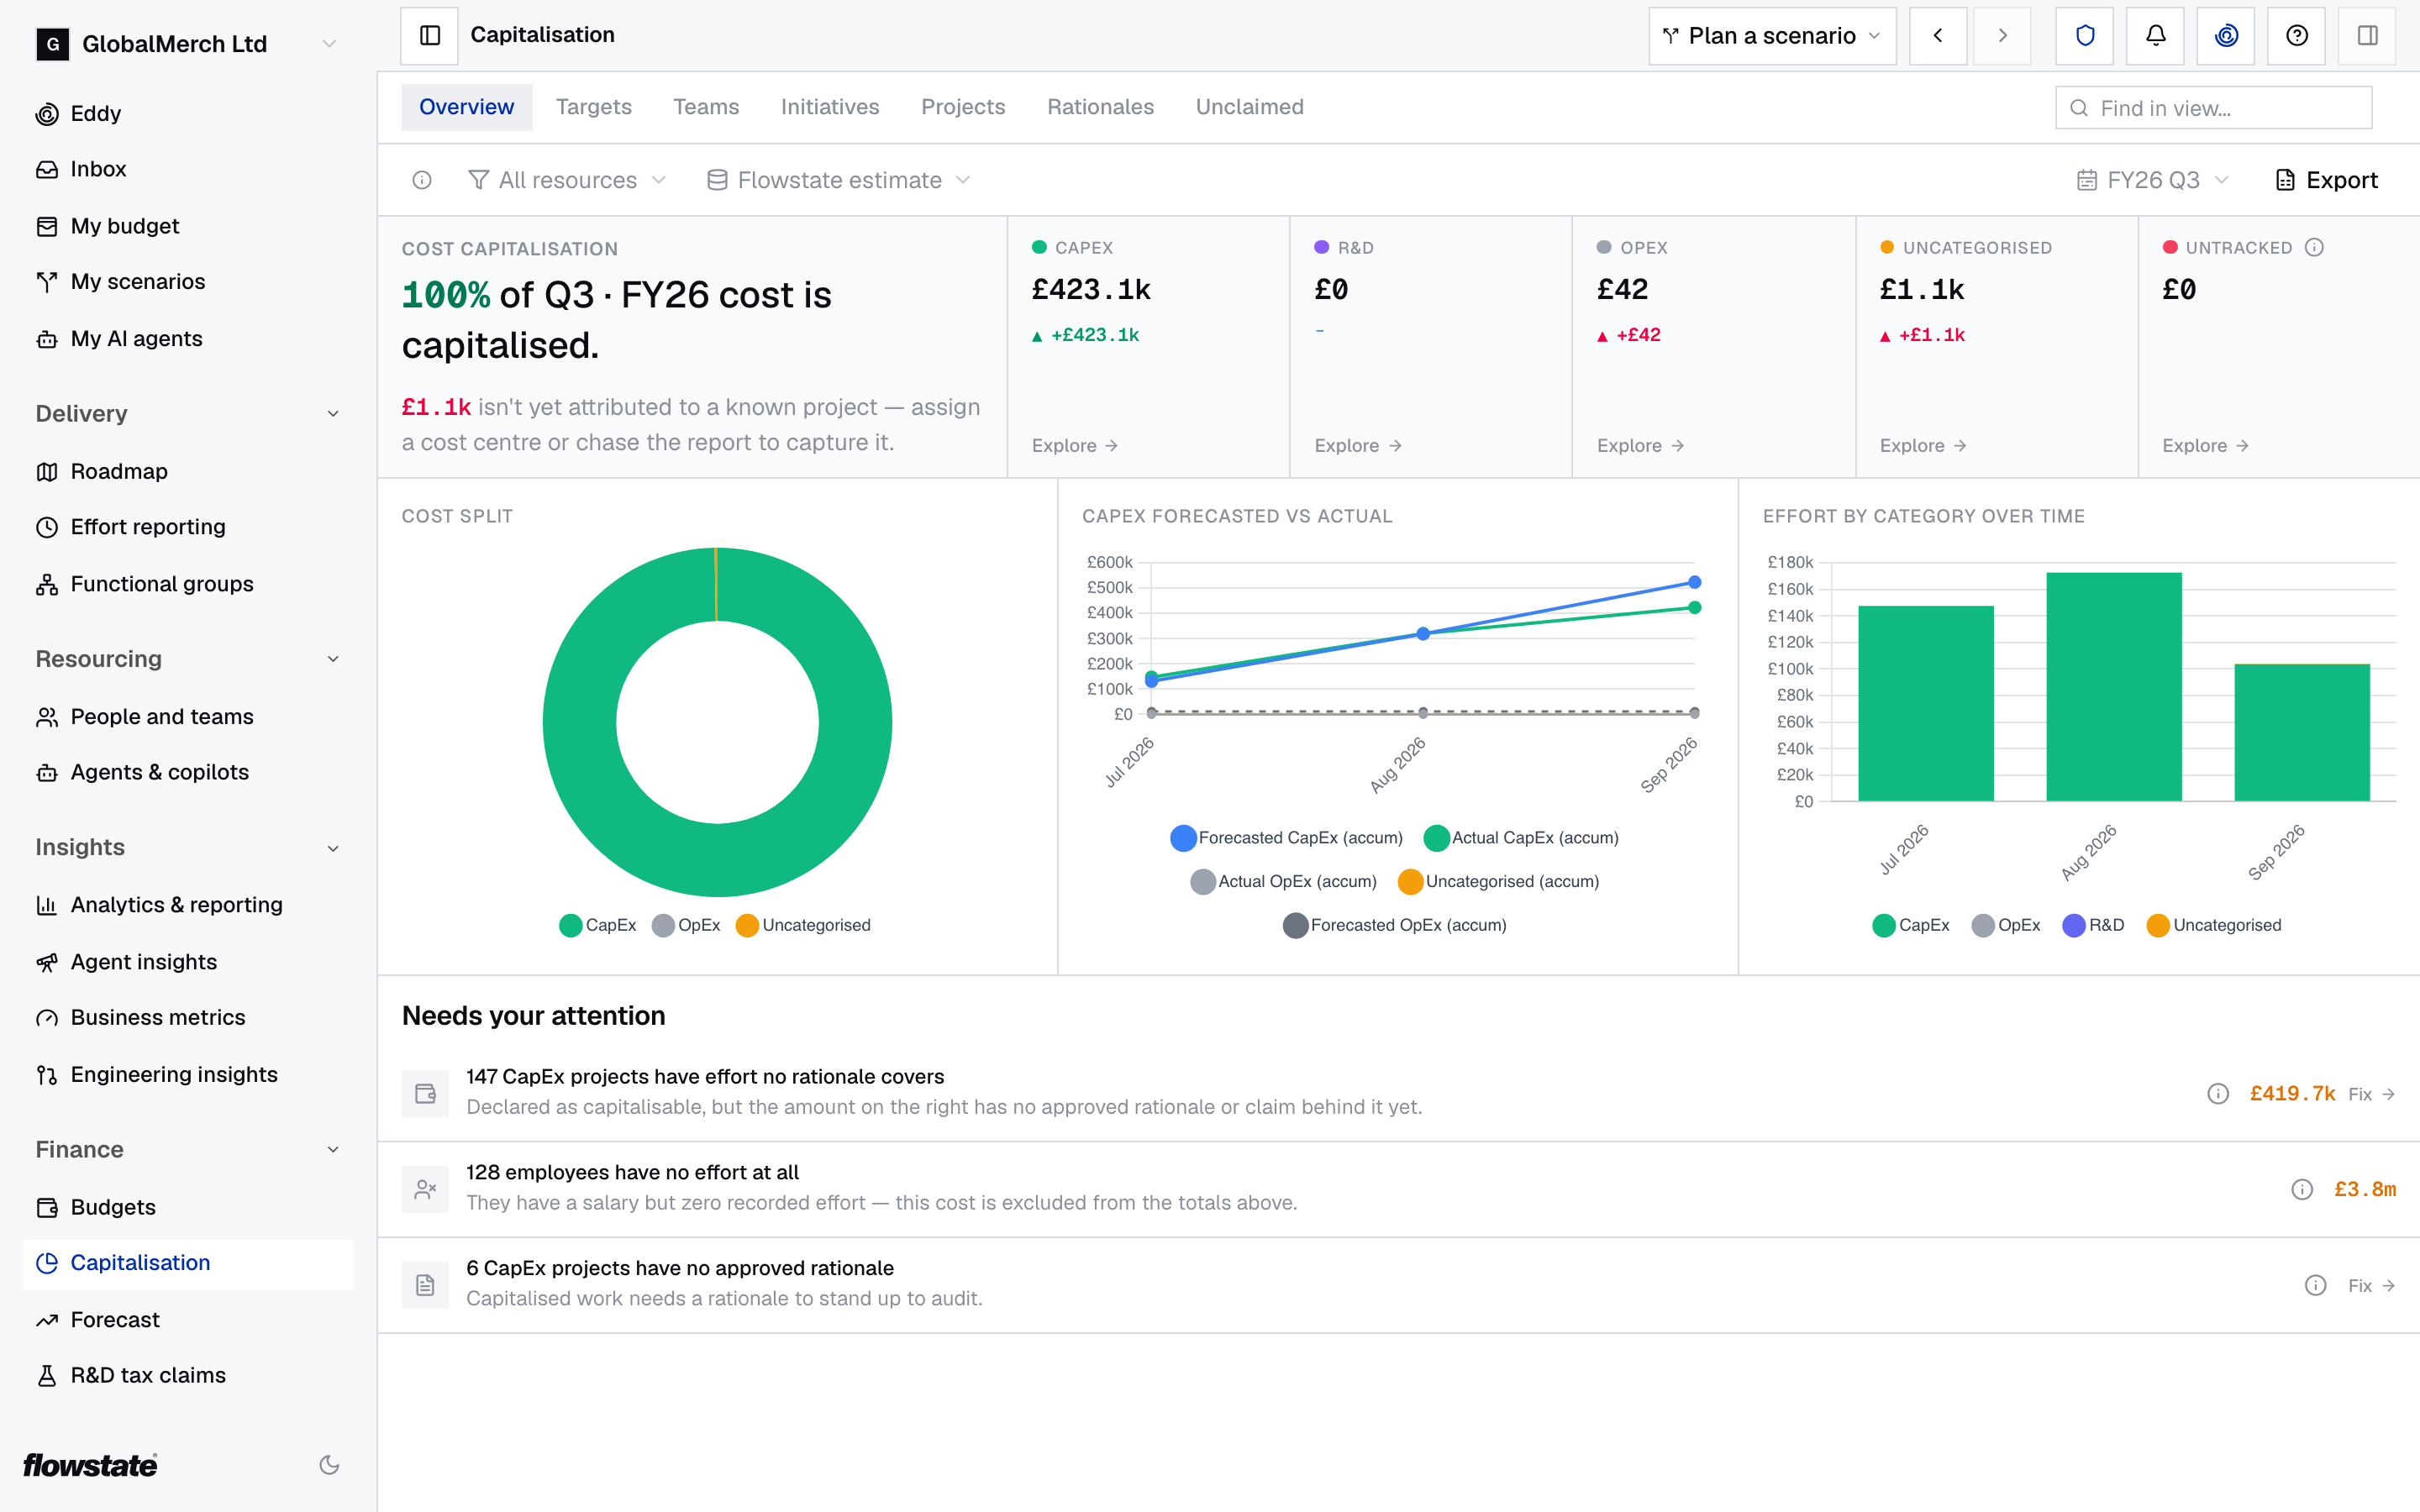
The headline
The big number is the share of the period’s cost that’s capitalised: CapEx, divided by CapEx, R&D, OpEx and Uncategorised added together. Untracked isn’t part of it.
Below it is the amount that isn’t yet on a known project — Uncategorised and Untracked together. It only shows when there’s some.
The cost band
| Figure | What it is | Explore opens |
|---|---|---|
| CapEx | Cost on projects whose cost centre is in the CapEx category | Projects, showing only CapEx |
| R&D | Cost on projects whose cost centre is in the R&D category | Projects, where R&D projects are grouped under R&D |
| OpEx | Cost on OpEx projects, plus holiday and leave, plus non-project work | Projects, showing only OpEx |
| Uncategorised | Cost Flowstate can’t place: projects with no cost centre or a cost centre with no category, and effort that isn’t on a known project | Projects, showing only Uncategorised |
| Untracked | Cost of effort by people who aren’t in any team. The warning icon beside it turns amber when there’s some | Unclaimed |
When the period is a quarter, every figure except Untracked shows how much it changed since the previous quarter. Green means better: a rise for CapEx, a fall for the others.
The charts
- Cost split — the same figures as a ring, with Holiday & leave and Non-project work shown apart from the rest of OpEx. Untracked isn’t in it. Hover over a slice to see its amount.
- CapEx Forecasted vs Actual — running totals through the period. Forecasted CapEx (accum) is what your allocations planned, and Actual CapEx (accum) is what effort shows. Lines for actual OpEx, Uncategorised and forecasted OpEx appear when there’s some. Calculating forecast… shows while the forecast loads.
- Effort by Category over time — a bar for each month, split into CapEx, OpEx, R&D and Uncategorised.
Actual figures follow Reporting source. If you can’t see financial figures, the charts show days and their titles end in (FTE).
What Needs your attention asks you to fix
Needs your attention lists what’s keeping the period’s figures from being complete, four rows to a page. A row only appears when there’s something to fix. Select the information icon on any row for How to resolve. Rows marked Fix take you to where you fix it.
| Row | Fix opens | What to do |
|---|---|---|
| ”… has no cost centre” | That project | It’s the costliest project with no cost centre. Set its cost centre on Projects |
| ”… CapEx projects have effort no rationale covers” | Projects, showing only CapEx | Get a justification approved for each project. Only people who can see financial figures get this row |
| ”… people have effort but no team” | Unclaimed | Put each person on a team |
| ”… employees have no effort at all” | No Fix | They’re paid but recorded no effort. Chase the missing effort, or confirm they’re between projects. Their cost isn’t in the figures above |
| ”… CapEx projects have no approved rationale” | Projects, showing only CapEx | Get each justification submitted and approved. The Rationale column shows where each is up to |
Teams
Teams has a row for each team, and No team for effort from people who aren’t in one. Under each name is how many projects it worked on.
| Column | What it shows |
|---|---|
| CapEx, OpEx | The team’s cost in each category |
| Uncategorised | Cost Flowstate couldn’t place. Amber when there’s any |
| FTE | Days of effort |
| CapEx % | CapEx as a share of the team’s total cost |
If you can’t see financial figures, you get FTE and CapEx % only, and CapEx % is worked out from days.
Select a team to drill into it.
Initiatives
Initiatives has the same columns as Teams, with a row for each initiative, added up from its projects. No initiative covers projects that aren’t in one. Under each name is how many projects it has.
Select an initiative to drill into it.
Projects
Projects lists the projects running in the period, grouped into CapEx, OpEx, R&D and Uncategorised by their cost centre, costliest first. Total at the bottom is the period’s total — or the category’s, when you came from Explore.
| Column | What it shows |
|---|---|
| Cost | The project’s effort cost in the period |
| FTE | Days of effort |
| Cost centre | Where cost goes while the project runs. Select it to change it |
| Post-completion CC | Where cost goes after the project’s end date. Amber when a finished project has none. See After a project ends |
| Rationale | Where the justification is up to |
Changing a cost centre needs access to change financial settings. A project with cost after its end date shows Post-completion OpEx beside its name.
The Rationale column shows:
| Shows | Meaning |
|---|---|
| Needs rationale | A CapEx project whose justification hasn’t been submitted, or was sent back or rejected |
| Submitted | In review. Below it is With and the approvers’ names, or Your approval when it’s waiting for you |
| Approved | Approved or completed |
| — | Not a CapEx project, or no justification has started |
Three rows aren’t projects. They show where the rest of the cost went:
| Row | Group | What it is | Selecting it opens |
|---|---|---|---|
| Holiday & leave | OpEx | Time logged as holiday or leave | Delivery → Effort reporting → All teams, at the first week of the period |
| Non-project work | OpEx | Time people put under non-project work | Delivery → Effort reporting → All teams, at the first week of the period |
| Unattributed effort | Uncategorised | Effort Flowstate couldn’t tie to a project | Its breakdown. See Clear unattributed effort |
Use Cost category to show only CapEx, OpEx or Uncategorised. Select a project to open it.
Unclaimed
Unclaimed lists the people Flowstate saw working in the period who aren’t in any team. Their effort doesn’t count towards a team, so team figures and CapEx targets miss it. The sentence at the top says how many people, how many days, and what that cost.
The columns are the same as on Teams.
Put someone on a team
Do this for an employee or contractor. You need access to change people.
- Select the person. Their side panel opens.
- Select Schedule.
- Under Teams, select Add.
- Choose the team.
- In Change Team, choose Move entirely to the target team or Split time with the target team. If you split their time, enter the Full-time equivalent (FTE).
- Set the Date of change to when they joined the team, and select Confirm Movement.
More in Plan someone’s time on teams and projects.
Drill into a team
Select a team on Teams to open it. Select Team spend at the top to go back.
Above the list:
- Flowstate estimate, Effort submissions and Unconfirmed gap compare the days Flowstate estimated for the team with the days submitted. A gap means weeks nobody has submitted — chase them to recover CapEx.
- Where it went: shows the team’s Holiday & leave, Non-project work and Unattributed effort, when there’s any.
Switch the view between:
- Team projects — each project the team worked on, with its Cost, Cost centre, days of effort (Allocated) and People. Select a project to see how many days each person spent on it.
- Team members — each person, with CapEx, OpEx, Uncategorised, FTE and CapEx %. Select an employee to see how many days they spent on each project.
In the window that opens, choose Quarter or Week to break the days down. The days follow Reporting source.
For No team, only Team members is available, and you can’t open a person.
Drill into an initiative
Select an initiative on Initiatives to open it. Select Initiative spend at the top to go back.
- The list shows each of the initiative’s projects, with its Cost, Cost centre and days of effort (Allocated). Select a project to open it.
- CapEx claims lists claims already made for the initiative: the claim period, how many projects it covers, and its status.
- Capitalise this initiative bundles its projects into one claim. See Capitalise a whole initiative.
Cost, CapEx claims and Capitalise this initiative need access to financial figures. No initiative has no project list — put those projects in an initiative first.
Open a project
Selecting a project on Projects opens People: everyone who logged time on it in the period, grouped by team, with each team’s subtotal and a Total. The project’s side panel opens on the right.
- Select a person to list the weeks their effort landed. Each week is marked submitted (part of a submitted week), manual (someone edited it) or assumed (neither).
- Select a week to open that team’s week in effort reporting. Weeks for people with no team don’t open.
The tabs at the bottom move between Overview (the project’s own page), People and Rationale (its justification — see Write and submit a justification).
Clear unattributed effort
Unattributed effort is effort Flowstate couldn’t tie to a project, so it’s neither CapEx nor OpEx. To see what makes it up, select the Unattributed effort row on Projects. The breakdown uses the period, Reporting source and Resource type you’ve chosen.
It’s split into three groups, each with a subtotal:
| Group | What it is | Fix |
|---|---|---|
| Unlinked PMS projects | Projects in your project tool that aren’t linked to a Flowstate project | Select Link to project, choose the project and confirm Link project. If Flowstate has a suggestion, select Accept suggestion to link to it straight away |
| Unattributed tickets | Each person’s effort on tickets with no project | Select Re-attribute in timesheet to open their week in effort reporting, then move the tickets |
| Projects missing a cost-centre | Projects whose cost centre isn’t in the CapEx or OpEx category | Select Set cost-centre and choose one |
Linking a project links it for your whole organisation, and moves its past effort onto that project for every team. After you link a project or set a cost centre, the breakdown updates.
Unattributed effort total is at the bottom. If some effort can’t be put in a group, an Unreconciled line above it shows how much.
If something’s not right
Cost shows as Uncategorised. The project has no cost centre, or the effort isn’t on a known project. Set the cost centre on Projects, or clear unattributed effort.
A finished project still has CapEx cost. Its end date hasn’t passed, or it has no Post-completion CC. Update the end date in your project tool, and set Post-completion CC on Projects.
Figures show as days, not money. You don’t have access to financial figures. Ask your Flowstate admin.
The figures don’t match the forecast. They measure different things: Capitalisation is actual cost from effort, and the forecast is planned cost from allocations. See Why the forecast and actuals can differ.
You think a project’s cost centre is wrong. See Review cost-centre recommendations.